Note
Click here to download the full example code
Plotting OMNI Data
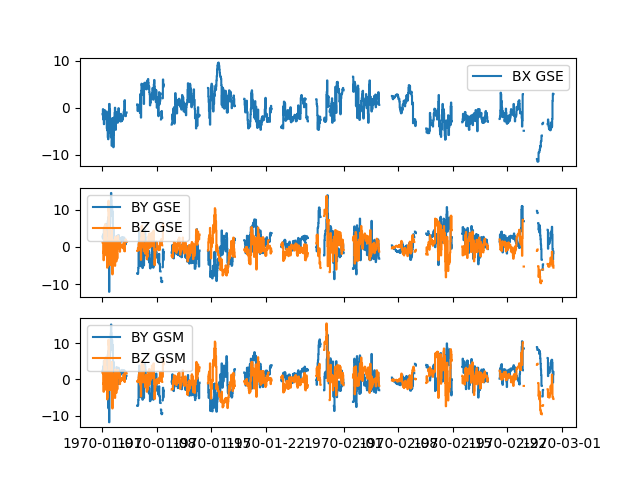
Importing and plotting data from OMNI dataset.

Out:
Downloading OMNI2_H0_MRG1HR for interval 1970-01-01 00:00:00 - 1971-01-01 00:00:00

0it [00:00, ?it/s]
5320it [00:00, 53195.48it/s]
6600it [00:00, 56631.89it/s]
import heliopy.data.omni as omni
import matplotlib.pyplot as plt
from datetime import datetime

starttime = datetime(1970, 1, 1)
endtime = datetime(1970, 2, 28)

omni_data = omni.h0_mrg1hr(starttime, endtime)

fig, axs = plt.subplots(3, 1, sharex=True)
axs[0].step(omni_data.index, omni_data.quantity('BX_GSE'), where='post', label='BX GSE')
axs[1].step(omni_data.index, omni_data.quantity('BY_GSE'), where='post', label='BY GSE')
axs[1].step(omni_data.index, omni_data.quantity('BZ_GSE'), where='post', label='BZ GSE')
axs[2].step(omni_data.index, omni_data.quantity('BY_GSM'), where='post', label='BY GSM')
axs[2].step(omni_data.index, omni_data.quantity('BZ_GSM'), where='post', label='BZ GSM')

for ax in axs:
    ax.legend()
plt.show()
Total running time of the script: ( 0 minutes 8.709 seconds)