
Note
Click here to download the full example code
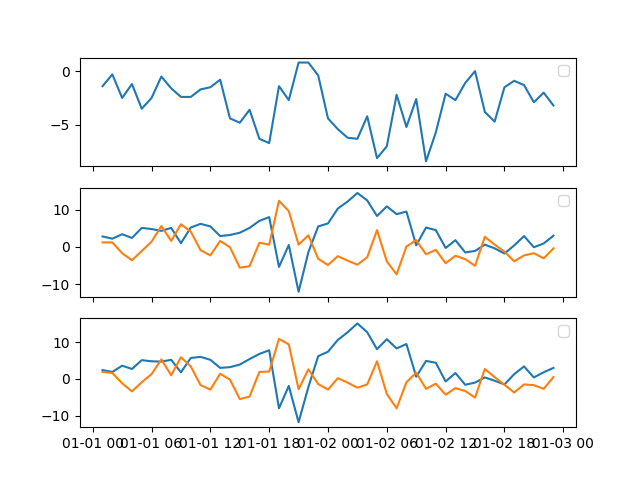
Importing and plotting data from OMNI Web Interface. OMNI provides interspersed data from various spacecrafts. There are 55 variables provided in the OMNI Data Import.
Out:
Creating new directory /home/docs/heliopy/data/omni/low
Downloading https://cdaweb.gsfc.nasa.gov/pub/data/omni//low_res_omni/omni2_1970.dat
import heliopy.data.omni as omni
import matplotlib.pyplot as plt
from datetime import datetime

starttime = datetime(1970, 1, 1, 0, 0, 0)
endtime = datetime(1970, 1, 3, 0, 0, 0)

omni_data = omni.low(starttime, endtime)

fig, axs = plt.subplots(3, 1, sharex=True)
axs[0].plot(omni_data.data['Bx GSE, GSM'])
axs[1].plot(omni_data.data['By GSE'])
axs[1].plot(omni_data.data['Bz GSE'])
axs[2].plot(omni_data.data['By GSM'])
axs[2].plot(omni_data.data['Bz GSM'])

for ax in axs:
    ax.legend()
plt.show()
Total running time of the script: ( 0 minutes 1.477 seconds)