
Note
Click here to download the full example code
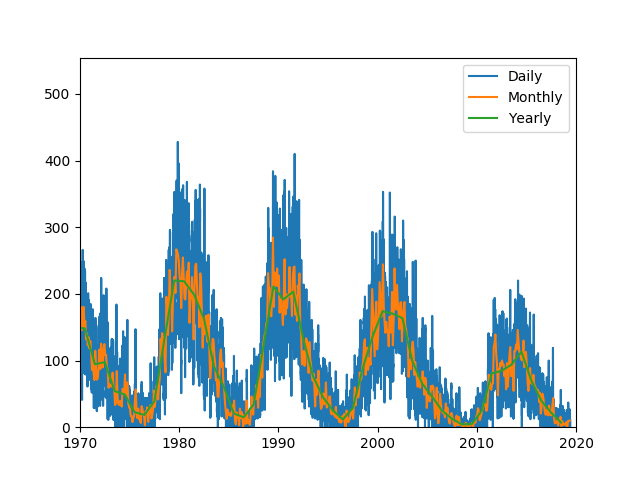
Importing and plotting sunspot number data.
import heliopy.data.sunspot as sunspot
import matplotlib.pyplot as plt
fig, ax = plt.subplots()

# Plotting Daily
data_daily = sunspot.daily()
print(data_daily.keys())
x_daily = data_daily['DecD']
y_daily = data_daily['Daily']
ax.plot(x_daily, y_daily, label='Daily')

# Plotting Monthly
data_monthly = sunspot.monthly()
print(data_monthly.keys())
x_monthly = data_monthly['DecD']
y_monthly = data_monthly['Monthly']
ax.plot(x_monthly, y_monthly, label='Monthly')

# Plotting Yearly
data_yearly = sunspot.yearly()
print(data_yearly.keys())
x_yearly = data_yearly['Y']
y_yearly = data_yearly['Y_Mean']
ax.plot(x_yearly, y_yearly, label='Yearly')

# Set some sensible plotting limits
ax.set_xlim(left=1970, right=2020)
ax.set_ylim(bottom=0)
ax.legend()
plt.show()
Out:
Index(['Y', 'M', 'D', 'DecD', 'Daily', 'Std Dev', 'No Obs', 'Def/Prov Ind'], dtype='object')
Index(['Y', 'M', 'DecD', 'Monthly', 'Std Dev ', 'No Obs', 'Def/Prov Ind'], dtype='object')
Index(['Y', 'Y_Mean', 'Std Dev', 'No Obs', 'Def/Prov Ind'], dtype='object')
Total running time of the script: ( 0 minutes 1.810 seconds)